

Scientific visualization architect | Science communicator | Monofin/Marathon swimmer
Wednesday, August 7, 2019
Tuesday, May 21, 2019
Journal for Neuroscience cover published!
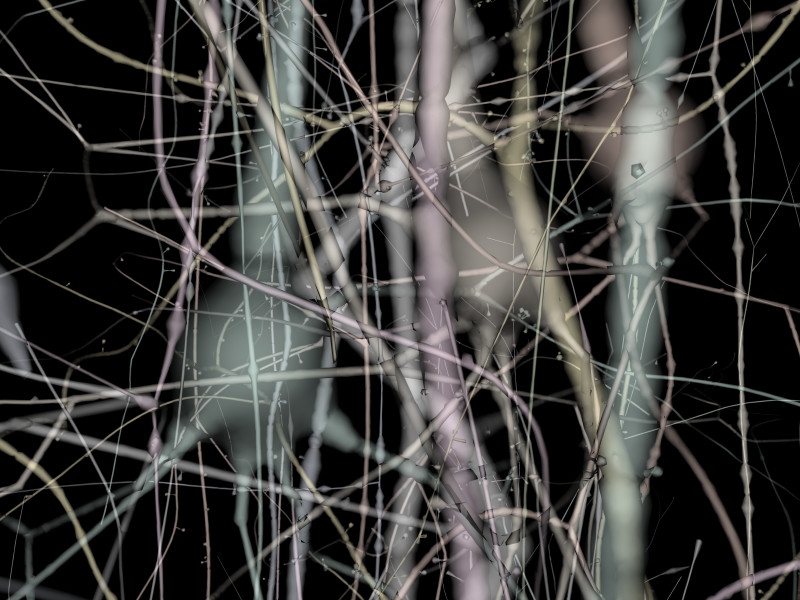
 Making an image of the brain always is a challenge. The idea behind the cover image is to pay tribute to the amazing work initiated by Camillo Golgi back in the late 19th century. His discovery of a staining technique called black reaction changed the way one could visualize brain structures. Recent studies have shown that the aesthetic of images representing data visualization in neuro-science plays a significant role in the way those image are understood.
In the last years, computer technologies have improved dramatically, together with the field of computational neuro-science. Thanks to advanced computer graphics techniques, it is now possible to reconstruct realistic shapes of neurons from a set of points and radii describing the structure of the cell. Many of those data sets for single neurons can be found on the web. Combining them together and placing them in space makes it a simple way to imagine what regions of the brain could look like if they were to be seen using Golgi’s technique.
In the near future, it seems clear that realistic, physically based rendering of in-silico data will become a necessary tool to understand how the brain functions.
But if those new tools are very promising, one should not forget the work of the pioneers, and this is what this cover image is all about.
Making an image of the brain always is a challenge. The idea behind the cover image is to pay tribute to the amazing work initiated by Camillo Golgi back in the late 19th century. His discovery of a staining technique called black reaction changed the way one could visualize brain structures. Recent studies have shown that the aesthetic of images representing data visualization in neuro-science plays a significant role in the way those image are understood.
In the last years, computer technologies have improved dramatically, together with the field of computational neuro-science. Thanks to advanced computer graphics techniques, it is now possible to reconstruct realistic shapes of neurons from a set of points and radii describing the structure of the cell. Many of those data sets for single neurons can be found on the web. Combining them together and placing them in space makes it a simple way to imagine what regions of the brain could look like if they were to be seen using Golgi’s technique.
In the near future, it seems clear that realistic, physically based rendering of in-silico data will become a necessary tool to understand how the brain functions.
But if those new tools are very promising, one should not forget the work of the pioneers, and this is what this cover image is all about.

Wednesday, January 30, 2019
Celebrating the beauty of the brain

So... I played, and I won :) I somehow became the winner of the NeuroArt contest for December 2018, which is great
I am extremely happy to be one the winners of the NeuroArt contest for December 2018.
Making an image of
the brain always is a challenge. The idea behind the cover image is
to pay tribute to the amazing work initiated by Camillo Golgi back in
the late 19th century. His discovery of a staining
technique called black reaction changed the way one could visualize
brain structures. Recent studies have shown that the aesthetic of
images representing data visualization in neuroscience plays a
significant role in the way those image are understood.
In the last years,
computer technologies have improved dramatically, together with the
field of computational neuroscience. Thanks to advanced computer
graphics techniques, it is now possible to reconstruct realistic
shapes of neurons from a set of points and radii describing the
structure of the cell. Many of those datasets for single neurons can
be found on the web. Combining them together and placing them in
space makes it a simple way to imagine what regions of the brain
could look like if they were to be seen using Golgi’s technique.
In the near future,
it seems clear that realistic, physically based rendering of
in-silico data will become a necessary tool to understand how the
brain functions.
But if those new
tools are very promising, one should not forget the work of the
pioneers, and this is what this cover image is all about.
Saturday, January 12, 2019
Full stack/frontend software engineer wanted!
Your mission if you accept it
The EPFL Blue Brain Project (BBP), situated on the Campus Biotech in Geneva, Switzerland, applies advanced neuroinformatics, data analytics, high-performance computing and simulation-based approaches to the challenge of understanding the structure and function of the mammalian brain in health and disease. The BBP provides the community with regular releases of data, models and tools to accelerate neuroscience discovery and clinical translation through open science and global collaboration.We are looking for a self motivated full stack/frontend software engineer (W/M) to join our team and help us with the development of our visualization tools.
You will be working in a dynamic team with highly skilled software engineers and our goal is to aid scientists in visualizing and understanding their (neuroscientific) data.
Main duties and responsibilities include :
Your responsibility will be to develop new features for our current interactive 3D viewer Brayns (on the frontend) and maintain existing ones, and to drive the development of our new hub application where the scientists can manage their data visualizations.
More information available here.

Tuesday, October 2, 2018
EPFL: Visual Computing Seminar
Super excited to visit Wenzel Jacob and give the following talk in the context of the Visual Computing Seminars.
One of the keys towards understanding how the brain works as a whole, is visualization of how the individual cells function. In particular, the more morphologically accurate the visualization can be, the easier it is for experts in the biological field to validate cell structures; photo-realistic rendering is therefore important. Brayns is a visualization platform that can interactively perform high-quality and high-fidelity rendering of neuroscience large data sets. Thanks to its client/server architecture, Brayns can be run in the cloud as well as on a supercomputer, and stream the rendering to any browser, either in a web UI or a Jupyter notebook.
At the Blue Brain project, the Visualization team makes intensive use of Blue Brain Brayns to produce ultra-high resolution movies (8K) and high-fidelity images for scientific publications. Brayns is also used to serve immersive visualization on the large displays, as well as unique devices such as the curved OpenDeck located at the Blue Brain office.
Brayns is also designed to accelerate scientific visualization, and to adapt to the large number of environments. Thanks to its modular architecture, Brayns makes it easy to use various rendering back-ends such as Intel's OSPRay (CPU) or NVIDIA's OptiX for example. Every scientific use-case such as DICOM, DTI, Blue Brain research, etc, is a standalone plug-in that runs on top of Brayns, allowing scientists and researchers to benefit from a high performance/fidelity/quality rendering system, without having to deal with the technical complexity of it.
Brayns currently implements a number of basic primitives such as meshes, volumes, point clouds, parametric geometries, and pioneers new rendering modalities for scientific visualization, like signed distance fields.
During this talk, I will explain the motivations behind the creation of the Brayns platform, give some technical insight about the architecture of the system and the various techniques that we already use to render datasets. I will also describe how new datasets, as well as rendering components (engines, shaders, materials, etc), can be added to the platform.
Links:
https://github.com/BlueBrain/Brayns
http://rgl.epfl.ch/courses/VCS18f
Blue Brain Brayns, A platform for high fidelity large-scale and interactive visualization of scientific data and brain structures
The Blue Brain Project has made major efforts to create morphologically accurate neurons to simulate sub-cellular and electrical activities, for example, molecular simulations of neuron biochemistry or multi-scale simulations of neuronal function.One of the keys towards understanding how the brain works as a whole, is visualization of how the individual cells function. In particular, the more morphologically accurate the visualization can be, the easier it is for experts in the biological field to validate cell structures; photo-realistic rendering is therefore important. Brayns is a visualization platform that can interactively perform high-quality and high-fidelity rendering of neuroscience large data sets. Thanks to its client/server architecture, Brayns can be run in the cloud as well as on a supercomputer, and stream the rendering to any browser, either in a web UI or a Jupyter notebook.
At the Blue Brain project, the Visualization team makes intensive use of Blue Brain Brayns to produce ultra-high resolution movies (8K) and high-fidelity images for scientific publications. Brayns is also used to serve immersive visualization on the large displays, as well as unique devices such as the curved OpenDeck located at the Blue Brain office.
Brayns is also designed to accelerate scientific visualization, and to adapt to the large number of environments. Thanks to its modular architecture, Brayns makes it easy to use various rendering back-ends such as Intel's OSPRay (CPU) or NVIDIA's OptiX for example. Every scientific use-case such as DICOM, DTI, Blue Brain research, etc, is a standalone plug-in that runs on top of Brayns, allowing scientists and researchers to benefit from a high performance/fidelity/quality rendering system, without having to deal with the technical complexity of it.
Brayns currently implements a number of basic primitives such as meshes, volumes, point clouds, parametric geometries, and pioneers new rendering modalities for scientific visualization, like signed distance fields.
During this talk, I will explain the motivations behind the creation of the Brayns platform, give some technical insight about the architecture of the system and the various techniques that we already use to render datasets. I will also describe how new datasets, as well as rendering components (engines, shaders, materials, etc), can be added to the platform.
Links:
https://github.com/BlueBrain/Brayns
http://rgl.epfl.ch/courses/VCS18f
Friday, August 10, 2018
EPFL: DICOM Photorealistic and interactive visualization
 Just created an initial version of a DICOM plugin for Brayns, in 4 hours... :)
Source code is there:
https://github.com/favreau/Brayns-UC-DICOM
 And you'll need the latest version of Brayns to make it work. Follow the readme instructions provided on the github page of the plugin and start enjoying cool visualization of your DICOM datasets.
Thursday, May 10, 2018
The music of neurons
Music generated from approximate brain simulation data... Just for the fun of it :)
Data is generated using Neuron and CoreNeuron:
https://github.com/BlueBrain/CoreNeuron
https://github.com/nrnhines/nrn.git
With the help of this tutorial:
https://github.com/nrnhines/ringtest
Once the tutorial is successfully completed, the following file is used to produce the music:
coreneuron_tutorial/sources/ringtest/coreneuron_data/spk1.std
This file contains the timestamp of each spike. This is translated into a MIDI file using the mido library.
https://github.com/olemb/mido
Data is generated using Neuron and CoreNeuron:
https://github.com/BlueBrain/CoreNeuron
https://github.com/nrnhines/nrn.git
With the help of this tutorial:
https://github.com/nrnhines/ringtest
Once the tutorial is successfully completed, the following file is used to produce the music:
coreneuron_tutorial/sources/ringtest/coreneuron_data/spk1.std
This file contains the timestamp of each spike. This is translated into a MIDI file using the mido library.
https://github.com/olemb/mido
Fractals love in high resolution
After all these years, still in love with fractals. Those ones are rendered with Brayns, on a 40MPixel curved display. Source code is here:
https://github.com/favreau/Brayns-Research-Modules/tree/master/fractals
https://github.com/favreau/Brayns-Research-Modules/tree/master/fractals
Thursday, April 5, 2018
Menger Sponge in Brayns
 Based on the very cool shader toy from Inigo Quilez, I ported the code to ISPC and exploited the vertorized units of the CPU to render the Menger sponge in real time:
As usual, the code is there:
https://github.com/favreau/Brayns-Research-Modules/blob/master/fractals/ispc/renderer/
More information on ray-marching and distance functions can be found on Inigo's website
Thursday, March 1, 2018
Contours and wireframe in ray-tracing
I created this simple shader that attempts to draw geometry contours using ray-tracing. The idea is to send extra rays, parallel to the camera ray, and translate according to the normal of the intersected surface. If the parallel ray hits the same geometry, it's not a contour.
That somehow seems to work, but that still needs a bit of refinement.
The code is in the ContoursRenderer:
https://github.com/favreau/brayns-research-module/tree/master/cartoon
And can be easily used with the Brayns viewer, with the following command line arguments:
braynsViewer --module cartoon --renderer contours


That somehow seems to work, but that still needs a bit of refinement.
The code is in the ContoursRenderer:
https://github.com/favreau/brayns-research-module/tree/master/cartoon
And can be easily used with the Brayns viewer, with the following command line arguments:
braynsViewer --module cartoon --renderer contours


Sunday, February 18, 2018
Transfer function editor in Jupyter Notebook
Just created a Jupyter Notebook widget for volume rendering with Brayns. Also improved the volume rendering module for better performance and image quality.


Install it with:
pip install ipyTransferFunction
The code sources are:
Transfer Function: https://github.com/favreau/ipyTransferFunction
Brayns: https://github.com/BlueBrain/Brayns
Volume rendering module: https://github.com/favreau/brayns-research-module


Install it with:
pip install ipyTransferFunction
The code sources are:
Transfer Function: https://github.com/favreau/ipyTransferFunction
Brayns: https://github.com/BlueBrain/Brayns
Volume rendering module: https://github.com/favreau/brayns-research-module

Saturday, February 10, 2018
Sharing my experimental modules (plugins) for Brayns
I created this Github repository to share my experiments with Brayns. It's all about shaders, volume rendering, custom cameras, etc.
https://github.com/favreau/brayns-research-module
Feel free to download, try, contribute, star the repo, etc :) Hope this will be helpful to anyone willing to enjoy ray-tracing based computer graphics.


https://github.com/favreau/brayns-research-module
Feel free to download, try, contribute, star the repo, etc :) Hope this will be helpful to anyone willing to enjoy ray-tracing based computer graphics.


Tuesday, January 23, 2018
Advanced interactive volume rendering
Realtime volume rendering using:
Source code: https://github.com/favreau/Brayns/tree/aidenoiser
Demo running on Quadro K6000 NVIDIA GPU (960x540 pixels)
- Phong and blinn shading. The normal is defined by a vector going from the voxel position to the barycenter of the surrounding voxels, weighted by opacity. I got the idea in the middle of the night, thanks to a strong winter storm that prevented me from getting a good rest, but that seems to work ok :-)
- Soft and hard shadows
- Deep learning denoiser (OptiX 5)
Source code: https://github.com/favreau/Brayns/tree/aidenoiser
Demo running on Quadro K6000 NVIDIA GPU (960x540 pixels)
Subscribe to:
Posts (Atom)